
Donnerstag, 27. Dezember 2007
Sonntag, 23. Dezember 2007
MACD To find market reversals
You can use MACD indicator with trends line to fine the major market reversal points.


Be aware of stock advisers(MARKUS FRICK)
Always make your own analysis and decide independently by yourself.
Listen what Andre Kostolany is saying about the stock advisers from here.
Listen what Andre Kostolany is saying about the stock advisers from here.
Freitag, 21. Dezember 2007
DAX: Current New Highs and New Lows Index
Blue points shows 52w highs of the DAX index.
 Year to Date 52 week DAX new highs and new lows index.
 Long term 52 week DAX new highs and new lows index.

Year to date DAX 20 Day new highs and new lows index. Long term DAX 20 Day new highs and new lows index.

If you do not know how to interpret this indicator, you can go to marketscreen.com to learn more about the interpretation of this indicator.
 Year to Date 52 week DAX new highs and new lows index.
 Long term 52 week DAX new highs and new lows index.
Year to date DAX 20 Day new highs and new lows index.
 Long term DAX 20 Day new highs and new lows index.
If you do not know how to interpret this indicator, you can go to marketscreen.com to learn more about the interpretation of this indicator.
Downloading single stock data of an index
If you are investing foreign markets you need to calculate some indicators by yourself. For example New highs and new lows indicator requires additional effort to estimate for the non-US markets e.g. Turkey, germany etc..
There are many websites for the US markets which provides also such kind of indicator graphs.
But for other cases we need to calculate this by ourselfts. The below excel macro shows you how you can download the 30 DAX stock data to make new highs new lows analysis of the DAX index.

There are many websites for the US markets which provides also such kind of indicator graphs.
But for other cases we need to calculate this by ourselfts. The below excel macro shows you how you can download the 30 DAX stock data to make new highs new lows analysis of the DAX index.

Dienstag, 18. Dezember 2007
Order Types
 Limit order: Buy order will be filled maximum at the limit value. Sell orders will be filled minimum at the limit value. e.g. a stock is currently trading at 47,8€. You do not want to pay more than 47,6€. Your order will only be filled at 47,6€ or for a better price (less than 47,6€).
 Stop-Market order: If the price of a security reaches or exceeds the value of the stop-market price the order will be an unlimited market order.
Stop-Limit order: Like stop market order but the order will be limit order instead of the market order.
Mittwoch, 12. Dezember 2007
Analyzing the Markets
 John Murphy has an excellent work on intermarket analysis. You can analyse the market direction by analysing the interrelations between the markets.
Joseph Ellis has an excellent book about the economic analysis "Ahead of the curve".
[1] Joseph Ellis, Aheadofthecurve
[2] John Murphy, intermarket analysis
CALCULATING THE PROTECTIVE STOPS

You can calculate your risk in the trade. In our case it is (142-132=) 10 euro. If you divide this by your acceptable risk level let say 2% of the capital which is 200€, you can find the number of stocks that you are allowed to buy. I used the google calculator to make this simple calculation. As you can see we are allowed to by 20 stocks for this trade.
Sonntag, 9. Dezember 2007
Using the VIX Indicator with the MACDHistogram

VIX indicator can be used with MACD Histogram to determine the market turning points. It can be an additional tool to confirm your entry.
Samstag, 1. Dezember 2007
NASDAQ/NYSE Ratio

Then the ratio is declining it means that NYSE is performing better than the NASDAQ. If the ratio is increasing it means that the NASDAQ is performing better than the NYSE. According to the Modified Dow Thoery NASDAQ is the leading index. If the ratio is higher than the 10 week moving average then it is bullish. If the ratio is less than the 10 week moving average then it is less bullish.
You can go to the stockcharts.com web site to see this ratio or you can click on this link.
Mittwoch, 28. November 2007
Risks of Investing

Unexpected events can interrupt the operations of the stock exchange.
ISTANBUL - The Istanbul Stock Exchange (IMKB) was unable to trade in Wednesday’s morning’s session after the exchange was cut off due to a broken fibre optic cable. According to a statement issued by the IMKB, data flow to the exchange had been interrupted after the fibre optic cables was severed during road work by the local municipality on Istinye Street, close to the near IMKB building.
“Therefore, opening session of the stock exchange has been postponed,” the statement said. “The opening time of the trading will be announced later.”
Though most of its employees are currently on strike, Turk Telekom said that it had dispatched technical teams to fix the problem."[1]
Source:
[1] NTVMSNBC 28.Nov.2007 http://www.ntvmsnbc.com/news/427877.asp
Montag, 26. November 2007
The Rule of Multiple Techniques
Technical analysis is more about probabilities. There is no indicator which always gives 100% correct signals. Therefore it is better to watch for confirmion of each indicator signal by other indicators. Arthur Sklarew decribes this in his book "Techniques of professional chart analysist" in the following way.
"Technicians know very well that the price chart analysis is not an exact science. No single chart technique yet discovered is infallible. Despite this lack of perfection, price chart analysis can very often give reliable forecasts of trend direction... ...Confirmation is therefore an essential component of every valid chart signal.
In addition to comparing price charts of different contract months and time scales, it has been my experience that the accuracy of any technical price forecast can be improved greatly by the application of a principle that I call the “Rule of Multiple Techniques.” The Rule of Multiple Techniques requires that the chart technician not rely solely on one single technical signal or indicator, but look for conformation from other technical indicators. The more technical indicators that confirm each other, the better the chance of an accurate forecast." page 8
Sonntag, 25. November 2007
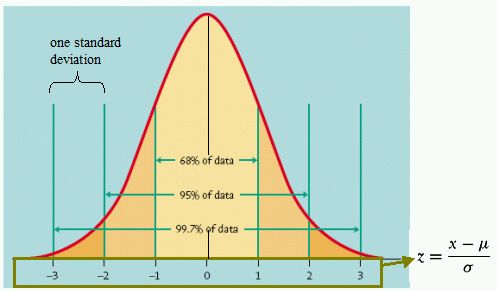
Finding the unusual moves
Standard distribution of the stock range can give us a clue about the market sentiment. If the range of the current index is above the normal levels we can expect the strong move next day.

Here are standard normal distributions of the indexes.


The image below is showing the unusual moves of the DAX index. As you can see this technique can be a strong confirmation for your other technical analysis tools.

Here are standard normal distributions of the indexes.


The image below is showing the unusual moves of the DAX index. As you can see this technique can be a strong confirmation for your other technical analysis tools.

Samstag, 24. November 2007
Trend qualifiers
New highs or new lows: New highs show the strength of the stock trend. If a stocking to a new high or low it is showing the strength of the upword move or downword move. A stock must hit new highs or lows if it is in an uptrend or downtrend. A two-month calendar high or low can be used.
Base breakouts: trending stocks must exhail before continuing further. During exhail they build a base(sideways movement). a base breakout is when a wide-range bar that goes higher occurs after a sideways market movement. Sideway movement shows that buyers and sellers are in gear.
When the stock breaks out of this base the buyers have gained control with the likelihood that the trend is developing[1]
Gaps in the direction of the trend: there various gaps. gaps in the direction of the trend suggests strong demand for the stock as buyers are bidding up the stock before it opens.[1]
Laps in the direction of the trend: a lap occurs when a stock opens greater than the prior day’s close but less than the prior day’s high. This indicates that traders are willing to hold the position overnight. While not as strong as a gap, a lap in the direction of trend suggests demand for the stock.[1]

Resources:
[1] Dave Landry on Swing Trading, Dave Landry

Montag, 22. Oktober 2007
CANSLIM Stock Screener ( with free tools )
CANSLIM method is developed my William O'Neil. He is the author of the book How to Make money in stocks. He describes this technique on his book. But this technique can also be applied by using freely available web sites.
Do not forget money management techniques. Always plan your entries, exits, and price target before entring a trade. Do not change the rule of the game once your are in the game.
Further reading:
[1] My CANSLIM investing blog entry
[2] How to Make money in stocks
- Start with the Market : Check the market direction from here, here, and here. You can check the dynamic yield curve from here. ( You can also read the general econmic outlook from here, but do not forget to act on your independent oponion. Never act on others suggestion or view).
- Look for strongest stocks in the strongest sectors from here. You can check the market carpet as well. Find stock which are making their 52-week high from here. Filter stocks which are not in your favourite list. (You can also read the general sector outlook from here,but do not forget to act on your independent oponion. Never act on others suggestion or view).
- Look for the leader in the strongest quarterly earnings growth in the industry from here.
- Check the the percent of shares held by the institutions from here.
- Check the annual earnings growth rate from here.
- You can check the key developments about the company from here, and here.
- Buy the stock which has a cup and handle price pattern.
Do not forget money management techniques. Always plan your entries, exits, and price target before entring a trade. Do not change the rule of the game once your are in the game.
Further reading:
[1] My CANSLIM investing blog entry
[2] How to Make money in stocks
Sonntag, 7. Oktober 2007
EXITS
Exits are very important for traders. because they determine the point which you realize your profits are losses. Setting proper exists in uptrends help you to trade in the direction of the market and prevents early exists. You have to determine your exit method that you will use BEFORE entering any trade and adhere to that plan. Do not change your plan once you are in the middle of the game!.
The following list shows different types of exit methods.
Resources:
[1] Exits: The Forgotten Component, (05/28/02),Ph.D RM Sidewitz, www.workingmoney.com
[2] A New Look at Exit Strategies, Charles Le Beau
[3] Classic Indicators, Linda Raschke
The following list shows different types of exit methods.
- Profit target : Exit if the market reaches to your target
- Time-based : Exit if your are in the market for a pre-determined time. e.g. 3 days
- Signal-generated: Exit if your indicator gives a sell signal e.g. price drops below 200days moving average
- Trailing : Adjust able stops. e.g. increase your stop upwards as the market moves upwards
- Pivotal juncture : Exist if market approaches to a critical target such as trendline, etc..
- Money management: Closes out a trade at a specified % of adverse movement.e.g. 2% loss
- Volatility: Risk level is increasing due to rising market volatility. Exit half of your position to protect half of your profits.
Resources:
[1] Exits: The Forgotten Component, (05/28/02),Ph.D RM Sidewitz, www.workingmoney.com
[2] A New Look at Exit Strategies, Charles Le Beau
[3] Classic Indicators, Linda Raschke
Sonntag, 30. September 2007
TRENDLINE
John Murpy explains the trendlines in his book like that:
"The simple trendline is possibly the most useful tool in the study of market trends. And you'll be happy to know that they're extremely easy to draw. Chart analysts use trendlines to determine the slope of a market trend and to help determine when that trend is changing. Although horizontal trendlines can be drawn on a chart, the most common usage refers to up trendlines and down trendlines. An up trendline is simply drawn under the rising reaction lows. A down trendline is drawn above the declining market peaks. Markets often rise or fall at a given slope. The trendline helps us to determine what that slope is."[1]
Up trend is defined as a series of higher highs and higher lows in sequence. Downtrend is defined as a series of lower highs and lower lows in sequence. A trend line touches to the low and high point as show on the image below[4].

HOW TO DRAW TRENDLINES?
John M.Pring explains tells that trendlines can be drawn by connecting two or more peaks or throughs, othwerwise it is not a valid trendline[2]. He mentions the importance of the closing prices. Because it sperates those who are willing to take home aposition overnight or over a weekend from those who are not.Therefore closing prices are more important chart points than highs or lows. Dr. Elder supports this view in his book. He mentions that with the following sentence.
"Most chartists draw a trendline through extreme high and low points, but it is better to draw it through the edges of congestion areas. Those edges show where the majority of traders have reversed direction. Technical analysis is poll-taking — and polltakers want to track opinions of masses, not of a few extremists. Drawing trendlines through the edges of congestion areas is somewhat subjective. You have to watch out for the temptation to slant your ruler."[3]
RATING TRENDLINES
Dr. Elder consider following criteria to evaluate the importance of a trendline[3]
Resources:
[1] The Visual Investor, John Murpy
[2] Technical Analysis Explained, John M.Pring, p.136
[3] Trading for a living, Dr. Elder, p.88-92
[4] Most Of What You Need To Know About Technical Analysis, (02/04/03)Matt Blackman, www.workingmoney.com
"The simple trendline is possibly the most useful tool in the study of market trends. And you'll be happy to know that they're extremely easy to draw. Chart analysts use trendlines to determine the slope of a market trend and to help determine when that trend is changing. Although horizontal trendlines can be drawn on a chart, the most common usage refers to up trendlines and down trendlines. An up trendline is simply drawn under the rising reaction lows. A down trendline is drawn above the declining market peaks. Markets often rise or fall at a given slope. The trendline helps us to determine what that slope is."[1]
Up trend is defined as a series of higher highs and higher lows in sequence. Downtrend is defined as a series of lower highs and lower lows in sequence. A trend line touches to the low and high point as show on the image below[4].

HOW TO DRAW TRENDLINES?
John M.Pring explains tells that trendlines can be drawn by connecting two or more peaks or throughs, othwerwise it is not a valid trendline[2]. He mentions the importance of the closing prices. Because it sperates those who are willing to take home aposition overnight or over a weekend from those who are not.Therefore closing prices are more important chart points than highs or lows. Dr. Elder supports this view in his book. He mentions that with the following sentence.
"Most chartists draw a trendline through extreme high and low points, but it is better to draw it through the edges of congestion areas. Those edges show where the majority of traders have reversed direction. Technical analysis is poll-taking — and polltakers want to track opinions of masses, not of a few extremists. Drawing trendlines through the edges of congestion areas is somewhat subjective. You have to watch out for the temptation to slant your ruler."[3]
RATING TRENDLINES
Dr. Elder consider following criteria to evaluate the importance of a trendline[3]
- Timeframe: the long the time frame the important the trendline
- Length: the longer the time frame the more valid it is
- Number of time it touches: The more contacts between prices and trendline the more valid that line.
- Its angle: The angle between a trendline and the horizontal exis reflects the emotional intensity of the dominant market crowd.
- Volume: If volume expands when prices move in the direction of a trendline, it confirms that trendline; if volume shrinks when prices pull back to a trendline, it also confirms the trendlines. If volume expands when prices return to a trendline, it warns of potential break; if volume shrinks when prices pull away from a trendline, it warns that the trendline is in danger.
Resources:
[1] The Visual Investor, John Murpy
[2] Technical Analysis Explained, John M.Pring, p.136
[3] Trading for a living, Dr. Elder, p.88-92
[4] Most Of What You Need To Know About Technical Analysis, (02/04/03)Matt Blackman, www.workingmoney.com
Sonntag, 9. September 2007
Basics: Money management for traders
The amount that you lose as a percent of your trading account is called drawdown. The picture below shows a 10000$ account which suffers a series of losses. The difference between the equity high and loss is called drawdown. A trader must try to minimize drawdowns for the long term survival.

The table shows percent of drawdowns and percent of required to return to recover the drawdowns. As you can see exposing unmanaged risk to the market can ruin your account. Therefore money management is important for traders.
 Money management is a part of the trader system. It answers the questions of "How many?" and "how much?".

Risk 2% on every trade: Never risk more than 2% of your invested capital. If you invest 10000 €, do not lose more than 200€ of this investment in a single trade. For example if you identified your entry point as 40€ and exit point at 38€, you would risk 2 € per stock. If you can risk 200€ in total and 2€ per share, you can find the number of share that you can invest in by dividing the 200€/2€=100 shares. You can buy 100 shares. That means you can invest 100*40€=400 euro in total for this trade.[2]
This basic method or other money management methods can determine whether your are allowed to enter the trade or not. For example if your expected loss is grater than your allowed risk exposure, you are not allowed to enter a trade.[3] You can use the same method to find out the total capital that you need have.
If a trader is exposing his total capital to more risk than allowed, this is overtrading. Traders should avoid to overtrade[1].
Cost averaging and pyramiding are not money management techniques. Cost averaging suggests that a trader should add more contracts to a losing position to decrease the average cost of the total contracts. Pyramiding is opposite of the cost averaging. It suggests that a trader should add more contracts to his wining positions[1].
Resources:
[1] The trading game, ryan jones
[2] Money Management Strategies for Futures Traders, Nauzer J. Balsara
[3] Special report on money management, Dr. Tharp, www.forexfactory.com/attachment.php?attachmentid=2488&d=1133658244
[4] Money Management (Pt. I):Controlling Risk and Capturing Profits By Dave Landry

The table shows percent of drawdowns and percent of required to return to recover the drawdowns. As you can see exposing unmanaged risk to the market can ruin your account. Therefore money management is important for traders.
 Money management is a part of the trader system. It answers the questions of "How many?" and "how much?".
- How many units of your investment should you put on at a given time?
- How much risk should you be willing to take?

Risk 2% on every trade: Never risk more than 2% of your invested capital. If you invest 10000 €, do not lose more than 200€ of this investment in a single trade. For example if you identified your entry point as 40€ and exit point at 38€, you would risk 2 € per stock. If you can risk 200€ in total and 2€ per share, you can find the number of share that you can invest in by dividing the 200€/2€=100 shares. You can buy 100 shares. That means you can invest 100*40€=400 euro in total for this trade.[2]
This basic method or other money management methods can determine whether your are allowed to enter the trade or not. For example if your expected loss is grater than your allowed risk exposure, you are not allowed to enter a trade.[3] You can use the same method to find out the total capital that you need have.
If a trader is exposing his total capital to more risk than allowed, this is overtrading. Traders should avoid to overtrade[1].
Cost averaging and pyramiding are not money management techniques. Cost averaging suggests that a trader should add more contracts to a losing position to decrease the average cost of the total contracts. Pyramiding is opposite of the cost averaging. It suggests that a trader should add more contracts to his wining positions[1].
Resources:
[1] The trading game, ryan jones
[2] Money Management Strategies for Futures Traders, Nauzer J. Balsara
[3] Special report on money management, Dr. Tharp, www.forexfactory.com/attachment.
Freitag, 7. September 2007
STOCK SELECTION STEPS
TOP DOWN ANALYSIS
- Determine the general trend of the market. Check the work markets as well. Trend represents price direction e.g. up, down, sideways. Oscilators are best utilized when trying to confirm or pinpoint trade entry/exit points within trading ranges
- assess the major market trends e.g. DOW, S&P500, NASDAQ
- assess the trends in specific industries, sectors including ETFs
- find stocks to buy during market and sector uptrends, or sell short during down trends
TRADING TIME FRAMES
- Long term "Position" trades: aim to capture extended price moves, lasting from week to several months. generally >12 months chart is usefull to analyse.
- Short term "Swing" trades: aim to capture minor price moves lasting from days to several weeks. generall last 3 months are relevant.
- intraday trading
STOCK SELECTION
1. Screen stocks based on the fundamental values
2. Use technical chart scanning tools to filter out this stocks
Find stock making new highs (parameters)
- price > short term high (1d,5d,21d)
- price > long term high (63d,200d,52w)
Find stocks in uptrend
- price > short term MA (1d,5d,21d)
- price > long term MA(63d,200d,52w)
- short term MA > Long term MA
3. Prepare a risk plan define entry, exit points.
Donnerstag, 6. September 2007
Fibonacci, Fractals and Financial Markets
some other interesting application of the fibonacci
[1] Who is fibonacci? http://lumberjocks.com/jocks/David/blog/1639
[2] WOOD Magazine fibonacci Gauge Demo. http://www.youtube.com/watch?v=5Xgw84Kwrh8
[3] Trading Fibonacci Numbers. http://www.traderslog.com/fibonaccitrading.htm
Sonntag, 2. September 2007
MARKET TRENDS (DOW THEORY)

Bear Markets of the German DAX index

Bear markets are shown below. Decision point is using 6 and 10 MA (weekly 17-43MA, daily 20-50MA) average on the long term charts to identify bear markets[1][2].
Major bull and bear markets result from fundamental changes in supply and demand[3]. Long term(primary) trends are driven by fundamental factors.
See:
[1] http://www.decisionpoint.com/TAcourse/TAcourseIntro.html
[2] http://www.pring.com/movieweb/KST_MCM.htm
[3] Trading for a living, Dr. Elder, p.65
Fractal Trading

a fractal must contain at least 5 bars. the middle bar must the longest bar and the other 4 bars must be shorter than the middle bar.
prices are the last thing that changes. first momentum changes.
Sonntag, 1. Juli 2007
DOLLAR AND COMMODITY INDECIES
DOLLAR INDEX
What is dollar index?
"Just as the Dow Jones Industrial Average provides a general indication of the value of the US stock market, the US Dollar Index (USDX®) provides a general indication of the international value of the US Dollar." [1]
"The main objective of the staff’s current indexes is to summarize the effects of dollar appreciation and depreciation against foreign currencies on the competitiveness of U.S. products relative to goods produced by important trading partners of the United States. " [2]
COMMODITY INDEX
Commodity index includes different commodities. The image below [3] shows a comparision of comodity indecies.
 Resource:
[1] http://www.akmos.com/main/forex/usdx.html
[2] http://www.federalreserve.gov/releases/h10/weights/
[3] http://onwirtschaft.t-online.de/c/84/64/32/8464324.html
Samstag, 30. Juni 2007
Basics: Technical Indicators
Technical indicators can be divided into three groups. Trend following indicators help to identify trends. oscilators help find turning points. Other indicators show the general changes in the mass pyschology.
[1] investpedia active trading
[2] Dow Jones Theory video (german)
[3] Stock Charts
[4] Trading for a living, Dr.Alexander Elder
- trend-following indicators
- If markets are moving trend-following indicators work best but gives false signals when the markets are flat.
- include moving averages, MACD, Accumulation/Distribution, and others
- they turn after the trend reverse (conincident/lagging indicators)
- oscillators
- If markets are flat, oscillators can help to identify turning points but gives false signals when the markets began to trend.
- include stochastic, ROC, Momentum, RSI, Elder-ray, force index, W %R, commodity channel index and others.
- they turn ahead of prices (coincident/leading indicators)
- and other indicators
- put/call ratio, new highs , new lows etc...
[1] investpedia active trading
[2] Dow Jones Theory video (german)
[3] Stock Charts
[4] Trading for a living, Dr.Alexander Elder
Sonntag, 17. Juni 2007
EARNINGS CYCLE

Companies report their earningn every 3 months. It is proven that earning suprises rises stock price. You can see the earnings announcments by check the earnings calendar of http://www.bloomberg.com/apps/ecal
90% of the companies report their earnings 6 weeks after the quarter.
References:
[1] http://www.decisionpoint.com/tacourse/Earnings.html
Mittwoch, 30. Mai 2007
Sonntag, 27. Mai 2007
Basics: Relative Valuation (Price Multiples)
In contrast to the discounted cash flow valuation, relative valuation contends that it is possible to determine the value of a company by comparing with similar companies on the basis of several relative ratios1. Relative valuation (also called price-multiples) is one of the most widely used valuation tool. Intuition behind the price-multiples is that we cannot judge whether a stock is undervalued, overvalued, or fairly valued without knowing what a share buys in terms of some other measure of valuation such as earning, assets, sales2. Price-multiples ratio measures what a share can buy in comparison to other per share value measure such as earnings per share. There are different valuation ratios. I will discuss mostly used price/earnings, price/cash flow, price/book value, and price/sales ratios.
Price-to-earnings ratio is popular in the investment community. Earnings power is the primary determinant of investment value. Price-to-earnings ratio is using earnings per share (EPS)3. Some companies have basic and diluted earnings per share in the income statement. Diluted earnings take account of the possibility that some convertible securities could increase the number of common shares outstanding.4 Diluted earnings per share should be used. There are two version of P/E ratio as trailing and leading P/E ratio. The P/E ratio has a disadvantage. Because, earnings are prone to manipulation.
Price to cash flow ratio is generally less prone to manipulation. Cash flows is important to the valuation and critical for credit analysis. EBITDA is typically use as a specific measure of Cash flow. However, depending on the nature of the industry different cash flow measures can be used such as Free Cash Flow. Cash flow per share should be expected for the next period.
Price to book value ratio is a widely used ratio. There is a excess relationship between the P/BV ratios and excess rates of returns5. It is necessary to estimate the end-year-book value per share for the next period. This can be derived from the historical growth rate by the sustainable growth formula (g=ROE*retention rate).
Price to sales ratio is relatively volatile in comparison to other ratios. This ratio is suitable for growth companies. A requirement for a growth company is strong consistent sales growth.
References:1 Investments, brawn, page 388
2 Equity asset valuation, cfa, page 166
3 Equity asset valuation, cfa, page 166
4 How to think like benjamin graham and invest like waren buffet, page 138
5 Eugene Fama, Kenneth French, “The Cross section of expected returns” journal of finance 47, no.2,june 1992
Practice: http://www.decisionpoint.com/tacourse/Fundamentals.html
Mittwoch, 2. Mai 2007
Basics: Lazy portfolios
What is a lazy porfolio? Lazy portfolios are do-it-yourself porfolios for passive investors. Paul B.Farrel is tracking the performance of the porfolio. Return of the lazy portfolio is higher then the S&P500. You also watch his video.
Performance of the lazy porfolio
Performance of the lazy porfolio
| Fund | Allocation | 1-year return | 3-year annu. return | 5-year annu. return |
| Vanguard Total Stock Market Index | 60% | 11.10% | 10.81% | 7.50% |
| Vanguard Total International Stock Index | 30% | 20.14 | 20.64 | 16.56 |
| Vanguard Total Bond Market Index | 10% | 6.45 | 3.17 | 4.87 |
| Total portfolio | 100% | 13.35 | 13.00 | 9.96 |
| S&P 500 Index | 11.83 | 10.06 | 6.27 |
Basics: Moving average lines & Put/Call ratio
MOVING AVERAGE LINES
Technical analyst are using the moving average prices of historical stock prices to analyze the long term trends. They are using two techniques first if 50-day moving average is above the 200 day moving average line that is an indicator of the bullish market inverse is true for bearish market. Secondly, if stock prices go above the moving average line accompanied by the volume increas, this is a bullish indicator.
We are using 200 day and 50 day moving average for on a 3 years prices chart. You can use shorter moving average depending on your analysis period.

PUT/CALL RATIO
The chicago board options exchange(CBOE) Put/Call Ratio is used by technicians. A high put/call ratio indicates a bearish indicator for technicians. Barrons.com pubslishes this ratio with additional comment.
Source: Investment Anylsis and portfolio managment, Reilly&Brown,7th edition, page 633, 639
Technical analyst are using the moving average prices of historical stock prices to analyze the long term trends. They are using two techniques first if 50-day moving average is above the 200 day moving average line that is an indicator of the bullish market inverse is true for bearish market. Secondly, if stock prices go above the moving average line accompanied by the volume increas, this is a bullish indicator.
We are using 200 day and 50 day moving average for on a 3 years prices chart. You can use shorter moving average depending on your analysis period.
PUT/CALL RATIO
The chicago board options exchange(CBOE) Put/Call Ratio is used by technicians. A high put/call ratio indicates a bearish indicator for technicians. Barrons.com pubslishes this ratio with additional comment.
Source: Investment Anylsis and portfolio managment, Reilly&Brown,7th edition, page 633, 639
Dienstag, 1. Mai 2007
Business cycles and sector rotation
Here are some pictures to identify the business cycles and to analyze the M of the CANSLIM method.

"The chart obviously simplifies a lot of detail but should give you a graphical understanding of the relationships between sectors and the state of the economy. You can also go the other way -- looking at the relative performance of the sectors to see where the economy is heading. You can do this by viewing Smart Money's Market Map or looking at Stock Chart's sector performance charts or StockChart's market view.

S&P has a similar classification.

You can read the regular columns of the sector rotation guru Sam Stavoll at Business Week's online web site.
You might want to check the industry rankings at the http://www.rabbittanalytics.com.
Source:
[1] http://www.heroncapital.com/sectormodel.html
[2] http://www.businessweek.com/investor/list/stovall_toc01.htm

"The chart obviously simplifies a lot of detail but should give you a graphical understanding of the relationships between sectors and the state of the economy. You can also go the other way -- looking at the relative performance of the sectors to see where the economy is heading. You can do this by viewing Smart Money's Market Map or looking at Stock Chart's sector performance charts or StockChart's market view.
S&P has a similar classification.

You can read the regular columns of the sector rotation guru Sam Stavoll at Business Week's online web site.
You might want to check the industry rankings at the http://www.rabbittanalytics.com.
Source:
[1] http://www.heroncapital.com/sectormodel.html
[2] http://www.businessweek.com/investor/list/stovall_toc01.htm
M of CANSLIM
CANSLIM suggests that you should study general market every they. It recommends to study three indicies.
S&P500: consisting of 500 compannies, this index is broader, more modern presentation of market action than the Dow.
Dow Jones industrial average(DJIA):This index consist of 30 widely traded stocks, and while it used to focus primarly on large, cyclical, industrial issues, it has broadened a little in recent years to include companies like coca-cola and home depot. it is a simple but rather out-of-date average to study because it is dominated by established, old-line companies that grow more slowly than today's more modern, enterpreneurial companies. Also its 30 stocks can be more easily manipulated.
The Nasdaq Composite: The more relevant and volatile index in recent years, the Nasdaq is home to the market's younger, more innovative and fast-growing companies. It includes 4000 companies that trade view the Nasdaq network of market makers, and it is more heavily weighted toward the technology sector.
Source: How to make money in stocks, william j.o'neil, page 48
Samstag, 28. April 2007
Basics: Industry Consolidation Curve

According to the article "The consolidation curve, Deans,Kroeger, Zeisel Dec.2002, Harvard Business Review" each industry goes through this cycle. A full cycle takes approx. 25 years. If you know where your industry stands you can optimaze your investment strategy e.g. growth v.s. value etc.
Freitag, 27. April 2007
Sell FCX?
Beta of the FCX is 2.07(yahoo finance). Firms with high betas are cyclic firms. GDP growth is published yesterday. This years 1Q growth is 1.3% which is less than the analyst estimations. This rate is the almost the same GDP growth rate 4 years ago.
Technical analysis also shows a downtrend. I think I need to build a strategy to profit from market up and downs. e.g. If there is a down trend sell at the top and buy the same position from down again. As you can see from the chart I could earn much money if I would apply this strategy.

UPDATE 03.05.2007: This stock is going upwards now. I think that was a short term down trend. I made a small research. I think this sector is still strong and fundamentals of the sector is not changed. this stock has still upwards potential. This down trend was a good opportunity to buy more FCX shares.
More Moly Stocks
I found more moly stocks using the same technique. I see that,except blue perl mining, all moly stock will have down trend. I will wait and buy when a reversal occurs. Tenajon is my favourite moly stock.


Donnerstag, 26. April 2007
Great Stocks Often have Great Peers
I read this ZACKS commentary article about 'Great Stocks Often have Great Peers'. The article in summary telling that if you find a great stock, analyze it characteristics and look at its peers in the same industry. This screen is actually a stock screen which is called modelling. I can confirm this. For example I was trying to find out famious stock picker Marcus Fricks stock picking strategy. His suggestions such as Blue Perl Mining, Forsys have c.a. 1000% return. I analyzed the industry dynamics and other stock in the industry. I found some. You can try to do the same.
I identified Moly Mines by using this technique.Current price is 3€ and daily change is 3%. According to technical MACD analysis it can go down but i have 7€ target price.

I identified Moly Mines by using this technique.Current price is 3€ and daily change is 3%. According to technical MACD analysis it can go down but i have 7€ target price.

Montag, 23. April 2007
Investing for Beginners
This guy made nice videos for beginners. I think he also wrote a book about investing.
Luckily I bought the Bauer Stock again!

There were no reason to sell the Bauer stock. I was right. I lost some money because of this unnecesary transaction. But i learned something and covered my losses.
Donnerstag, 19. April 2007
I bought BAUER AG again

I overreacted to the change. I bought the BAUER again again. Its price has increased after I bought it.
MY FIRST LOSS BAUER AG

I made my first loss with BAUER AG (WKN 516810). I had to make more economic reasoning to understand why the markets are going down. I think the markets will go up again but I already sold my BAUER AG Stocks.
Montag, 9. April 2007
when to sell a stock?
It is as much important as to know when to sell a stock as to buy. There are the following 3 CANSLIM methods that you can flow when selling a stock.
- Always sell when to stock falls 8% of its cost
- In a market downtrend, reduce your holdings
- Take profits when the stock is 20%-25% up.
CANSLIM investing
I am currently reading a book about CANSLIM investing. This method is good for beginnners.
I found another usefull checklist for the beginners at the investors.com website which I also found in the CANSLIM investing book. You can also watch the CANSLIM investing video.
1. Consider buying stocks with each of the last three years' earnings up 25%+, return on equity of 17%+ and recent earnings and sales accelerating.
2. Recent quarterly earnings and sales should be up 25% or more.
3. Avoid cheap stocks. Buy higher quality stocks selling $15 a share and higher.
11. Buy mostly in the top six broad industry sectors in IBD’s New High List.
12. Select stocks with increasing institutional sponsorship in recent quarters.
13. Current quarterly after-tax profit margins should be improving, near their peak and among the best in the stock's industry
14. Don’t buy because of dividends or P-E ratios.
15. Pick companies with a superior new product or service.
16. Invest mainly in entrepreneurial New America companies. Pay close attention to those with an IPO in the past 8 years.
17. Check into companies buying back 5% to 10% of their stock and those with new management.
18. Don’t try to bottom guess or buy on the way down. Never argue with the market. Forget your pride and ego.
19. Find out if the market currently favors big-cap or small-cap stocks.
20. Do a post-analysis of all your buys and sells. Post on charts where you bought and sold each stock. Evaluate and develop rules to correct your major past mistakes.
Dienstag, 3. April 2007
Investor's Checklist: Rules for successful stock investing
I am reading The Five Rules for Successful Stock Investing: Morningstar's Guide to Building Wealth and Winning...By Pat Dorsey at the moment. I found the following checklist on the page 11.
- Have a personal discipline, do not listen crowds. It is therefore crucial to have solid well-grounded investment philosopy.
- Do not buy a stock unless you understand their business.
- Look for companies with compatitive advantage.
- Do not buy a stock without a margin of safety.
- Buy and hold stocks for the long term.
- Know when to sell. For example sell when it exceeds its instrinsic value.
Basics: S.W.O.T. Analysis
SWOT analysis is a powerful technique to analyse the strengths, weakness, opportunities, and threats of a company. Therefore it is also an important tool for the equity analysis and for the research documents. But which questons can we ask to analyze each 4 items easly? Here are some questions that you can ask.
STRENGTHS
1. Does the company have a high level of competence?
2. Does the company have competitive skill?
3. Is the company ahead on the experience curve?
4. Does the company have adequate financial resources?
5. Does the company have a good reputation with buyers?
6. Is the company an acknowledged market leader?
7. Does the company have well-conceived functional area strategies?
8. Does the company have access to economies of scale?
9. Is the company somewhat insulated from strong competitive pressures?
10. Does the company have proprietary technology?
11. Does the company have better advertising campaigns than the competition?
12. Is the company good at creating new products?
13. Does the company have strong management?
14. Does the company have superior technological/technical skills?
15. Does the company have cost/pricing advantages?
WEAKNESS
1. Does the company have no clear strategic direction?
2. Are the company facilities obsolete?
3. Is the company lacking managerial depth and talent?
4. Is the company missing some key skills or competencies?
5. Does the company have a poor track record in implementing strategy?
6. Is the company plagued with internal operating problems?
7. Is the company falling behind on Research & Development.
8. Does the company have a narrow product line.
9. Does the company have a weak market image.
10. Does the company have below average marketing skills.
11. Is the company unable to finance needed strategy changes.
12. Does the company have higher overall costs relative to our key competitors.
13. Does the company have subpar profitability.
OPPORTUNITIES
1. Is there additional customer groups that we could serve.
2. Is there new markets or market segments to enter.
3. Can the company expand our product/service line to meet customer needs.
4. Can the company diversify into related products.
5. Can the company control sourcing or supply activities (vertical integration.)
6. Are falling trade barriers opening foreign markets to the company.
7. Are rivals of the company becoming complacent.
8. Is the market growing faster than in the past.
9. Will Fewer regulatory requirements making doing business easier for the company.
THREATS
1. Are Low-cost foreign competitors entering the market.
2. Are sales of substitute products rising.
3. Is the market growing more slowly than expected.
4. Are there adverse shifts in foreign exchange rates and/or trade policies.
5. Are regulatory requirements becoming onerous.
6. Is the company vulnerable to changes in the business cycle or to recessions.
7. Are the company's customers and/or suppliers enjoying growing bargaining power.
8. Are buyers’ needs and tastes changing in directions that point away from our current expertise.
9. Are demographic changes having a negative impact on business.
10. Is It easy to enter this industry (very low barriers to entry).
11. Could Technology change this industry with little or no warning.
Sources:
- http://www.mindtools.com/pages/article/newTMC_05.htm
- THE CONSULTANT’S TOOLKIT, Mel Silberman, page 4
Mittwoch, 28. März 2007
Experience with the general investment society presentations

I decided to participate German CFA Society presetation. Head of M&A of one of the Frankfurt's bank was going to present the general trends in Automobile sector. The enterence cost 25 € but i decided to participate because i could build networks. It was a one hour presentation in the launch time. So nobody had time and it was not directly good opportunity for networking but I could get some info about the automobile industry. I heard in the presentation that Porsche wants to increase its steak in Volkswagen after the presentation I made a research and added VW to my test porfolio. Porsche increased its steak in VW to 30%. The stock is increase from 86€ to 117€ in one month. I thought that VW can learn many things from VW and bought (113€) VW after the transaction of Porsche is complete. I heard that according to german law 30% steak in a firm mean a takeover and porsche do not want to do this at the moment. I also read sell recomendations. Finance theory tells that sell recomandations are not often. So I want to sell my shares after 5 days I bought them. I sold the share with -11€ loss ( with additional -15€ transaction costs). But I am now happy to minimize my loss.

Mittwoch, 28. Februar 2007
My first test with the ETF

International equity investing and valuation is becuase of accounting differences and language bariers is difficult. But emerging markets are growth drivers of the world. I tough it could be a good idea to buy an emerging market index. I can remember from my studies that Exchange Traded Founds are optimal for this purpose. I read somewhere that management cost of the iShares are not much so I added iShares China 25 to my porfolio. The above image shows the performance of the index in one month. I think index funds are good for beginners who does not know anything about valuation etc... but can analyze the general trends.
Sonntag, 25. Februar 2007
My first invesment porfolio test

I was waiting for my friend in a bookshop. I picked up a book Which is called "the little book of investing" or something. Which explains the basics of investing. I found out in the book that there are sometools which are called stock screeners. I search in internet and found out such tools. I made a ranking and picked the top stocks in my list. I then used finance.google.com web site to test my strategy. I created a porfolio there and started to watch the developments for 1 month.
I used different methods when constructing this porfolio. I first used Moder Porfolio Theory and historical prices (instead of expected prices) to build the porfolio allocation.
I found out later that my return would be higher if I would allocate the porfolio based on the market capitalization instead of the MPT allocation. So I though that I need to do anything here to find out more about the porfolio allocation strategies.
Abonnieren
Posts (Atom)